


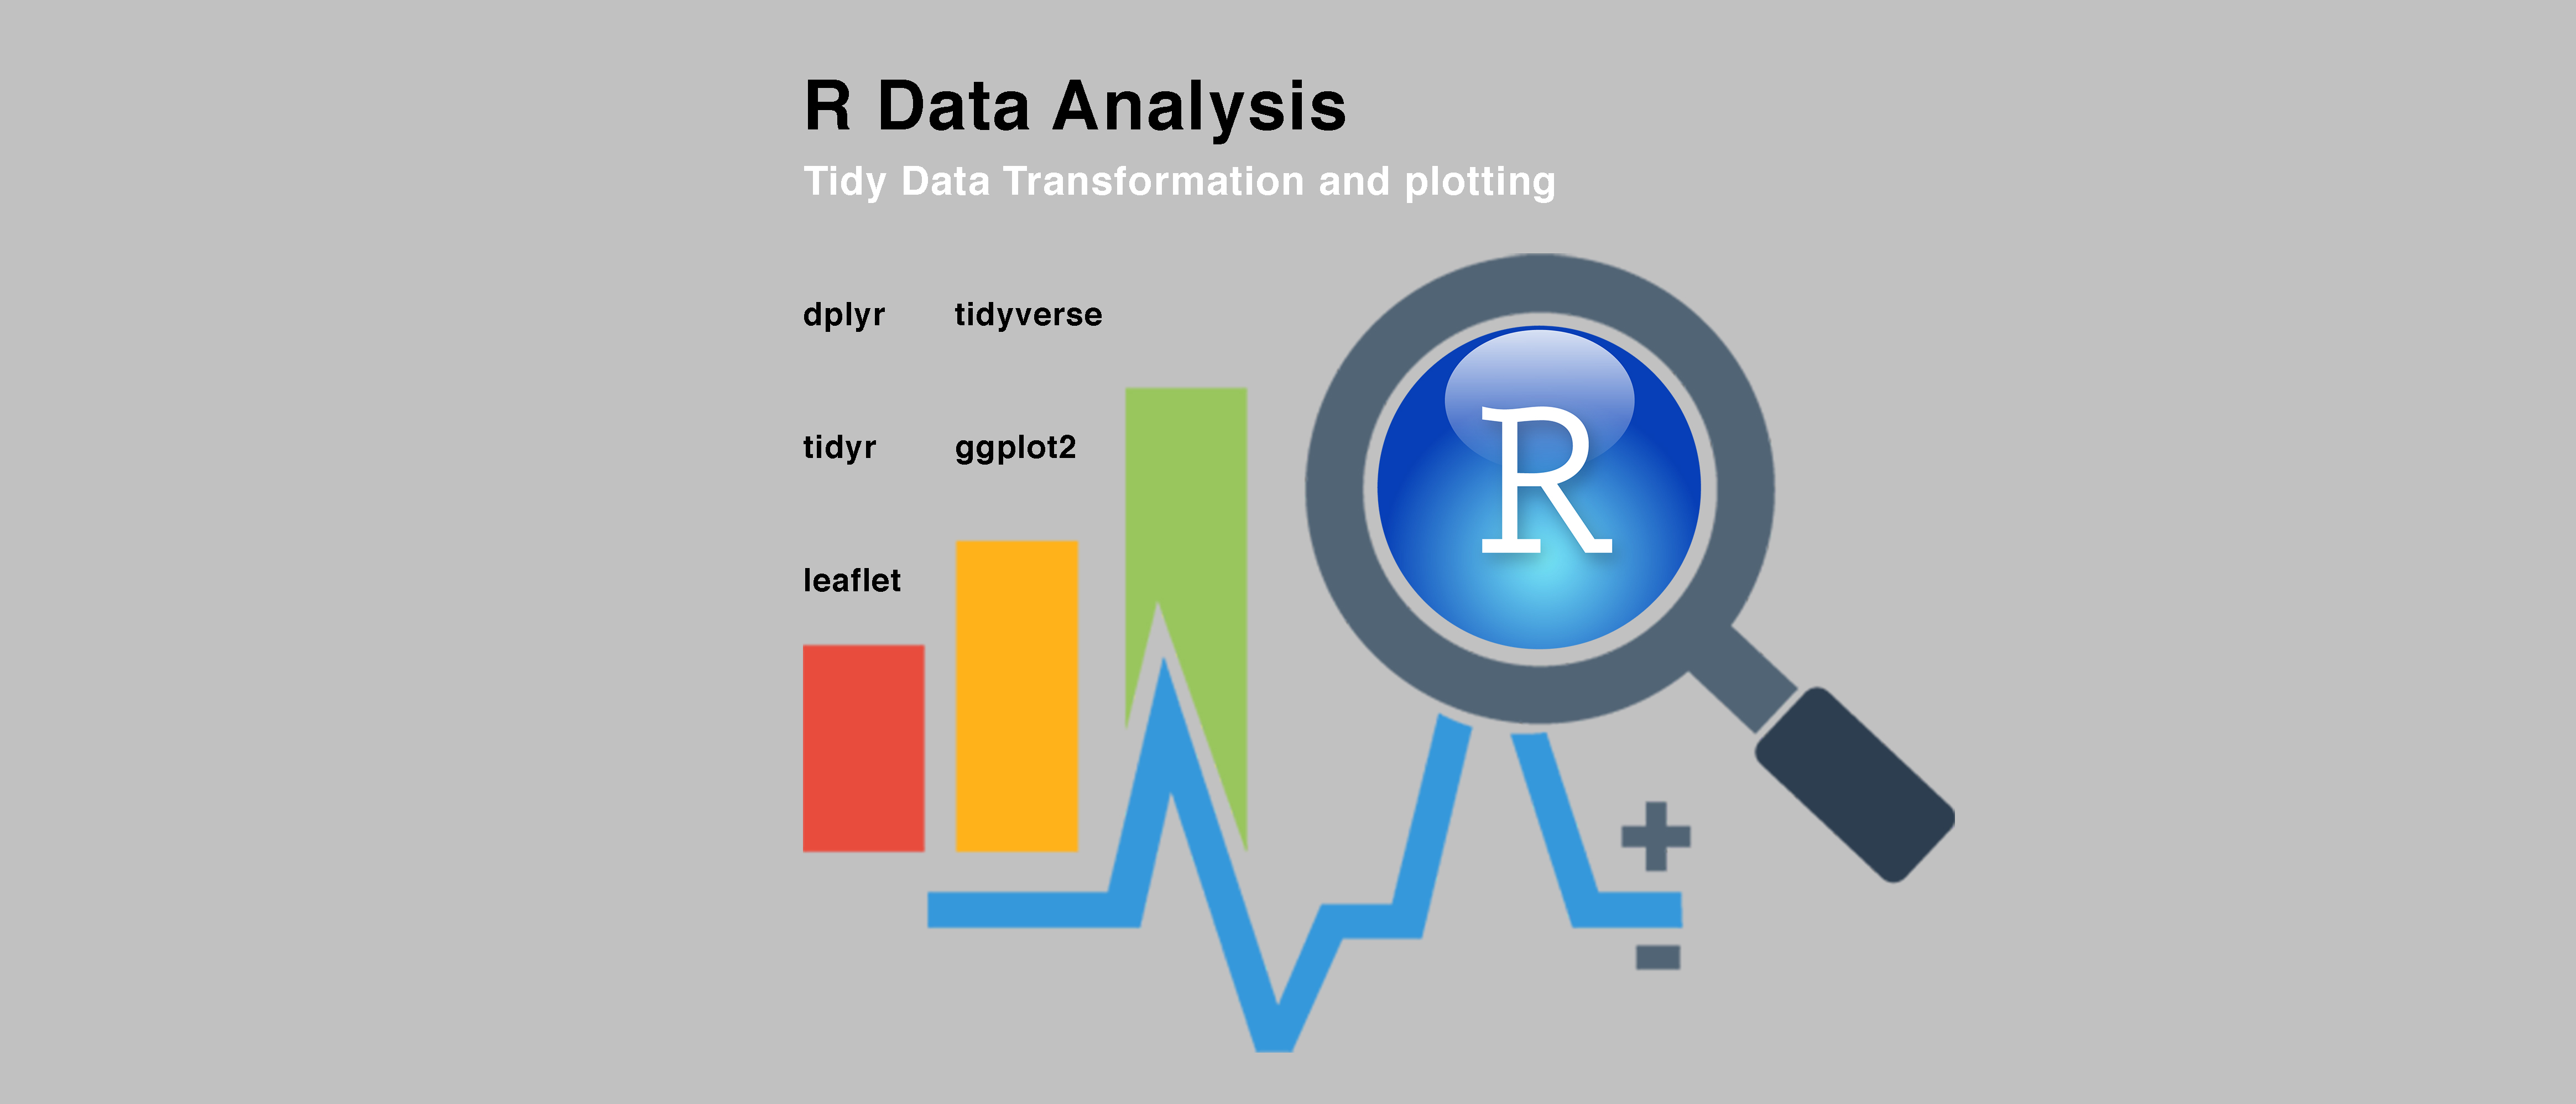
Data Analysis with R for Business Intelligence
-
 By
Aoife Brennan
By
Aoife Brennan
- 03/Jul/2024
- 0 Students
Course Description
Unlock the power of data to drive smarter business decisions no advanced statistics degree required. In this practical, hands-on course, you’ll learn how to use R, one of the most powerful tools for data analysis and visualization, to explore datasets, uncover trends, and create compelling reports that inform strategy, marketing, operations, and finance.
Why Learn Data Analysis with R for BI?
Businesses across every industry rely on data to optimize pricing, understand customers, forecast demand, and measure performance. R is widely used in academia and enterprise for its flexibility, rich ecosystem (like tidyverse and ggplot2), and strong statistical capabilities. Mastering R for business intelligence makes you a valuable asset in any data-driven organization.
What You’ll Learn:
- Import, clean, and transform real-world business data using tidyverse (dplyr, tidyr, readr)
- Summarize key metrics with descriptive statistics and pivot-style aggregations
- Visualize insights professionally with ggplot2: bar charts, line trends, scatter plots, dashboards
- Analyze customer behavior: segmentation, cohort analysis, and churn prediction basics
- Measure campaign performance and A/B test results
- Forecast sales or demand using time series fundamentals (with forecast and tsibble)
- Build interactive reports with R Markdown and flexdashboard
- Connect to databases and Excel files for live data pipelines
- Apply best practices for reproducible, readable, and maintainable analysis
- Present findings clearly to non-technical stakeholders
Why Choose This Course?
Focused entirely on business contexts, this course uses realistic datasets sales records, customer surveys, web analytics and avoids complex math in favor of actionable insights. You’ll complete projects like a marketing performance dashboard and a quarterly business review report. Includes downloadable templates, cheat sheets, and step-by-step workflows you can reuse at work.
By the end, you’ll be able to independently analyze business data and deliver clear, evidence-based recommendations.
Enroll now and become the go-to person for data-driven decision-making in your team.
Course Curriculum

Aoife Brennan
Senior Lecturer in Technology & Innovation | Bridging Code, Design, and CommerceBased in Dublin, Ireland, Dr. Aoife Brennan is a dynamic educator and technologist known for her rigorous yet inspiring approach to teaching the disciplines that power the modern digital economy. With a background spanning computer science, interaction design, and financial technology
Reviews
KES68,460.00
Course includes:
-
 Level
Level
-
Intermediate
Beginner
-
 Duration
50h
Duration
50h
-
 Lessons
28
Lessons
28
-
 Quizzes
7
Quizzes
7
-
 Certifications
Yes
Certifications
Yes
-
 Language
-
Francais
English